Local Markets

Charlotte Reclaims a Spot Among the Top 10 Rent Growth Markets

The nation’s leader for apartment inventory growth in this cycle is now among the nation’s leaders for rent growth over the past year.

Aggressive development in Charlotte over the past nine years has grown the number of apartments there by 35.5%. The sheer volume of new units has limited the amount that operators could raise rents without also risking a rise in the number of vacancies at their properties. However, they have found short periods when completions temporarily dip that they could be aggressive more on pricing.

They’re finding one such period now. Monthly rents in Charlotte climbed 4.1% in the 12 months ending March 2019, with momentum especially strong in the market’s Class A apartments. In turn, Charlotte, which hasn’t been a top-performing market for nearly six years, claimed the #10 spot for rent growth among the nation’s largest 50 markets in March. That’s actually the second consecutive month in the top 10 for Charlotte, which placed #9 with a 4.2% increase in February.

By comparison, the U.S. averaged annual rent growth in 3.2% in both February and March. Phoenix and Las Vegas topped the leaderboard with increases above 8% in both months.

During most of the previous 18 months, Charlotte’s rent growth trailed the national average. In November, that trend reversed as Charlotte began growing rents faster than the U.S. norm. The last time Charlotte broke into the top 10 for rent growth w…

During most of the previous 18 months, Charlotte’s rent growth trailed the national average. In November, that trend reversed as Charlotte began growing rents faster than the U.S. norm. The last time Charlotte broke into the top 10 for rent growth was in April 2013 when prices were growing by 4.4%, compared to the then-national average of 3.1%.

Charlotte’s rent growth progress has happened despite seeing vast amounts of new supply this economic cycle. Over the last nine years, Charlotte has grown its inventory base by 4.5% annually, on average. Annual new supply peaked most recently in 4th quarter 2016 when nearly 9,000 units were delivered, accounting for 5.6% inventory growth. Since then, new completion volumes have come down to hover at or below the 8,000-mark. In the past year, completions totaled 7,100 units, representing 4% of exiting stock and the lowest volume since 2015.

From a demand standpoint, Charlotte has been in equilibrium with supply. In the final two quarters of 2018, supply and demand stood within 100 units of each other. Though absorption has softened slightly in the first months of 2019 – a normal occurr…

From a demand standpoint, Charlotte has been in equilibrium with supply. In the final two quarters of 2018, supply and demand stood within 100 units of each other. Though absorption has softened slightly in the first months of 2019 – a normal occurrence in the seasonally slow winter months – annual demand remains healthy at about 6,600 units.

As absorption has softened slightly, so has occupancy, though at 94.8% in March 2019, occupancy remains strong. Nationwide, occupancy is a shade tighter at 95.3%. Year-over-year, Charlotte’s occupancy showing was down a slight 20 basis points (bps). Recent highs in occupancy came in July and August 2018 as new supply was moderate – for Charlotte, at least – and leasing ramped up, causing occupancy to surge to 95.7%. Charlotte’s occupancy is expected to pick back up again after 1st quarter 2019.

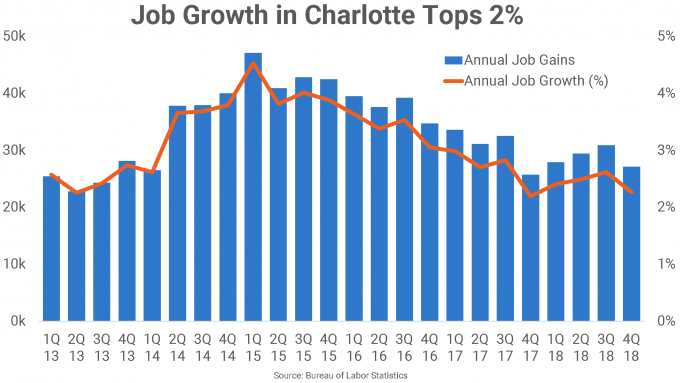
While still strong historically, employment growth in Charlotte has come down from the peak figures this market was seeing just a few years ago in 2015. In the year-ending February 2019, Charlotte added about 24,700 jobs, growing its employment base 2.1%.

Demand drivers remain solid in Charlotte, allowing leasing to keep up with supply. But rent growth has fluctuated with completion volumes, and currently, the market is seeing fewer units come online they in previous months. However, that’s like…

Demand drivers remain solid in Charlotte, allowing leasing to keep up with supply. But rent growth has fluctuated with completion volumes, and currently, the market is seeing fewer units come online they in previous months. However, that’s likely to change in the course of the next year. In the near term, Charlotte’s rent growth is forecasted to trend closer to the U.S. average as annual delivery volumes inch closer to the 8,000-unit mark.

Credited Sources

Real Page

Apartment Construction is Remarkably Spread Out in Austin

Austin has seen one of the nation’s most aggressive inventory growth rates during the current cycle, and 2019 is set to deliver more of the same. But unlike in most other market leaders for inventory growth, developers in Austin haven’t focused their efforts on any certain area. Instead, construction has been remarkably spread out across the Austin market.

In total, apartment developers have completed more than 60,000 new units in Austin during the current economic cycle, which began in early 2010. This new stock grew the existing inventory base by a stunning 30.8%. This was the second-largest increase among the nation’s 50 largest apartment markets.

Inventory-Growth-Leaders-table-e1551375855812.png

Also growing their apartment stocks by about a third in the cycle were Charlotte, where almost 47,000 units were delivered, and Nashville, which saw the completion of nearly 36,000 units. In both of those Southeast markets, a handful of submarkets accounted for the bulk of new units in the cycle. Charlotte’s Uptown/South End received nearly a quarter of the market’s total new apartments. In Nashville, a third of deliveries went to the downtown Central Nashville area.

Out of Austin’s 16 submarkets, 11 have recorded delivery of 3,500 units or more during the current cycle, with only two receiving supply of more than 5,000 units. Not one submarket accounted for even a 10% share of the deliveries seen during the current cycle. By spreading these completions out across the market, individual submarkets have mostly avoided periods of oversaturation.

Southwest Austin and Cedar Park received the biggest completion volumes, with about 5,600 units delivering in Southwest Austin and nearly 5,500 units coming online in the northwestern Cedar Park area. Even these supply leaders each accounted for only about 9% of the market’s total new supply tally from the past eight years. New product in both locales was absorbed fairly quickly. While completions in Cedar Park increased the existing inventory base by more than 70%, this was an area that had seen very little new product before the cycle began.

By-Submarket-chart-e1551375971755.png

Accounting for about 8% of Austin’s cycle delivery volumes were the northern submarkets of Pflugerville/Wells Branch, Round Rock/Georgetown and North Central Austin as well as the southern university community of San Marcos. These are the four least expensive submarkets in Austin.

Even Austin’s urban core – the expensive Downtown/University area – only received about a 7% share of new supply in the current cycle. The Arboretum accounted for Austin’s smallest slice of the completion pie, with 0.5% of the total.

As a result of new product additions being geographically dispersed, occupancy in Austin has closely mimicked the U.S. norm. That’s significant given the sheer volume of new units delivered to Austin over the course of this cycle, and a rare feat for such a high-development market. Rent growth, however, has been more prone to swings.

In the year ahead, overall delivery volumes in Austin are expected to remain elevated, as 2019 is on tap to be the sixth consecutive year in which completions reach 8,500 or more units. Some performance slowdown is expected, given the length of this…

In the year ahead, overall delivery volumes in Austin are expected to remain elevated, as 2019 is on tap to be the sixth consecutive year in which completions reach 8,500 or more units. Some performance slowdown is expected, given the length of this cycle’s supply wave and the mounting completions.

For more on performance expectations for Austin’s apartment market, see 2019 U.S. Apartment Market Outlook.


Atlanta Lands Among National Rent Growth Leaders

apartment-market-data-research-reports-multifamily-mpf-research-construction-atlanta-e1549561795623.jpg

Historically a rent growth underperformer, Atlanta’s apartment market has seen considerable price increases during the current economic cycle, and now performs well ahead of the national norm.

Atlanta ranked among the country’s rent growth leaders in 2018, with a price increase of 4.8%. Among the nation’s largest 50 apartment markets, only three bested this performance: Las Vegas, Phoenix and Orlando.

It’s historically been uncommon for Atlanta to raise rents ahead of overall U.S. averages, partially because supply volumes tend to run high in this market. This gave Atlanta an advantage when the national building spree started during the current cycle, and, with the help of a strong local economy, the market absorbed its share of heightened completions relatively well. With occupancy strengthening in the past few years, Atlanta operators were comfortable pushing rents to new heights.

Looking back, rent growth in the Atlanta apartment market hung behind much of the nation for the better part of the past 20 years. But in mid-2013, Atlanta rent growth pulled ahead of the U.S. norm and continued to gain momentum until topping out at 7.4% in early 2015. While that performance has since moderated a bit, today’s growth pace remains strong, a few ticks ahead of the market’s cycle average of 4.1% and well beyond the national standard of 3.3%.

Primarily responsible for Atlanta’s move into the rent growth spotlight has been the performance in the Class C stock, according to the latest RealPage Asset Optimization webcast. As the Great Recession ended in 2009, price positioning bottomed out.…

Primarily responsible for Atlanta’s move into the rent growth spotlight has been the performance in the Class C stock, according to the latest RealPage Asset Optimization webcast. As the Great Recession ended in 2009, price positioning bottomed out. At that time, Atlanta’s more affordable Class C units were suffering annual rent cuts of more than 12%. While the other two product lines were also logging price declines, the damage was less severe, with cuts of roughly 6% to 7%.

Throughout the course of the current economic cycle, the more affordable units have logged the most rent growth progress. For the first few years, all product lines saw rent change mostly improve. Class C units gained ground quickly and peaked at 6% in 2015, overtaking growth in the Class A stock. At the end of 2018, rent growth wasn’t far from that peak at 5.6%. This was one of the best performances seen nationwide for Class C units. The affordable stock did better in only two other markets in 2018: Las Vegas (6.3%) and Phoenix (5.8%).

Atlanta’s Class B product logged a stronger peak at 9.3% in 2015, but has since come down notably, landing at 5.7% in 2018. Class A stock peaked earlier, logging 8% rent growth in 2014 before the increases started to fall dramatically. By year-end 2018, annual rent growth in the most expensive product line was moderate at 3.2%.


While Atlanta rent growth surpassed U.S. norms recently, occupancy here still trails national averages, but not by much. At 94.7%, Atlanta’s late 2018 rate is one of the best showings this market has seen in two decades and is less than 100 basis po…

While Atlanta rent growth surpassed U.S. norms recently, occupancy here still trails national averages, but not by much. At 94.7%, Atlanta’s late 2018 rate is one of the best showings this market has seen in two decades and is less than 100 basis points (bps) below the U.S. reading. Occupancy in Atlanta has traditionally run about 300 bps to 400 bps below the national average.